
The best product in this store nearly missed the restock, and not because it was selling badly. It was selling in a place the usual report does not really look at.
Quick background so the numbers make sense. There is an apparel brand we run marketplace operations for. 354 products, listed on TikTok Shop and Shopee at the same time, one restock budget. Before the last purchase order went out, we pushed 30 days of exports from both platforms through our model, the Data Compass download on the TikTok side and Business Insights on the Shopee side, and read them together instead of separately.
Most sellers plan restock off TikTok numbers. TikTok is where the lives are, where the content runs, where everyone is looking. Do that here and the order would have been mostly graphic tees. The category that actually earns hardest per view would have gotten nothing.
Why can't you read one platform and guess the other?
Small confession before the findings. Our first pass at this data was wrong. One of the exports was mislabeled, we treated a Shopee file as TikTok data, and the output looked completely plausible while being nonsense. We caught it, rebuilt the numbers net of refunds and cancellations, and the rebuilt version is what you see in these charts. Worth mentioning because the mistake taught us the point of this whole article: the two platforms are shaped so differently that mixing them up quietly poisons everything downstream.
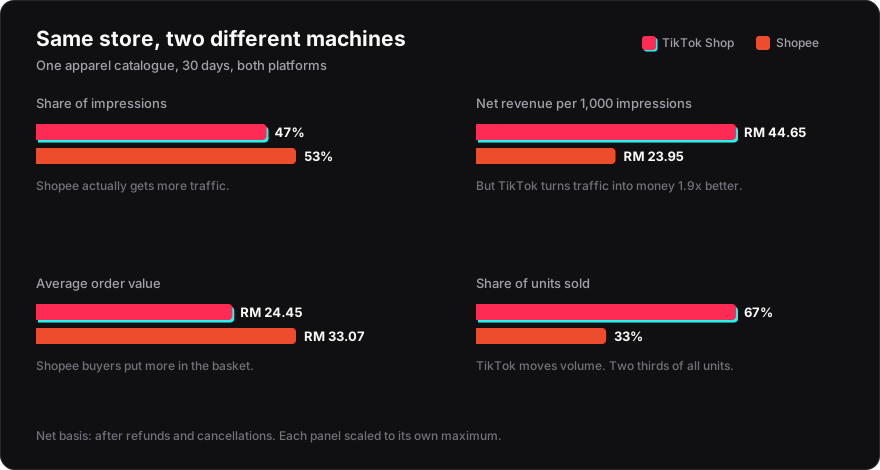
Look at the month. Shopee brought more eyeballs, 53% of all views. TikTok made RM 44.65 from every 1,000 views against Shopee's RM 23.95, so nearly double. But Shopee's average order was RM 33.07 versus RM 24.45 on TikTok. People browse Shopee with a fuller cart in mind. Meanwhile TikTok shifted two thirds of all units sold. Same shirts on both sides, completely different buying behaviour.
Where was the good product hiding?
Tees behave the way you expect. Impulse purchases, content driven, TikTok's home turf, 76% of that category's revenue from TikTok.
Denim went the other way and this is the finding that changed the purchase order. 72% of denim revenue came from Shopee. Buyers there compare cuts and prices for a while before they commit, which suits a RM 60 pair of jeans much better than a live stream does. Per 1,000 views, denim earned RM 48, more than any other category in the store, and it did that with only 15 products listed.
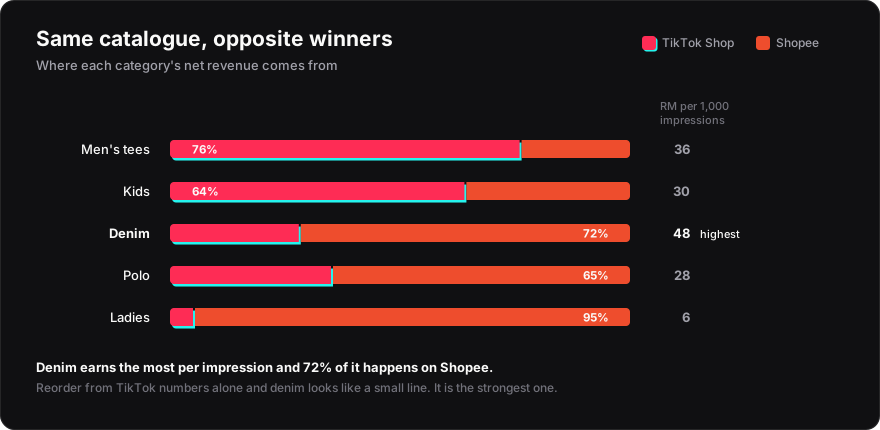
A TikTok-only report shows denim as some minor line you keep alive out of habit. Read both platforms together and it turns out to be the strongest earner the brand has, wanting more stock and more pushes, on Shopee specifically. The ladies line told the opposite story, over 60,000 views returning about RM 6 per thousand, which no amount of restocking will save.
What did the brand actually get?
Every one of the 354 products came out of the model with one of 5 verdicts attached: reorder now, scale up, keep testing, fix the listing, or delist.
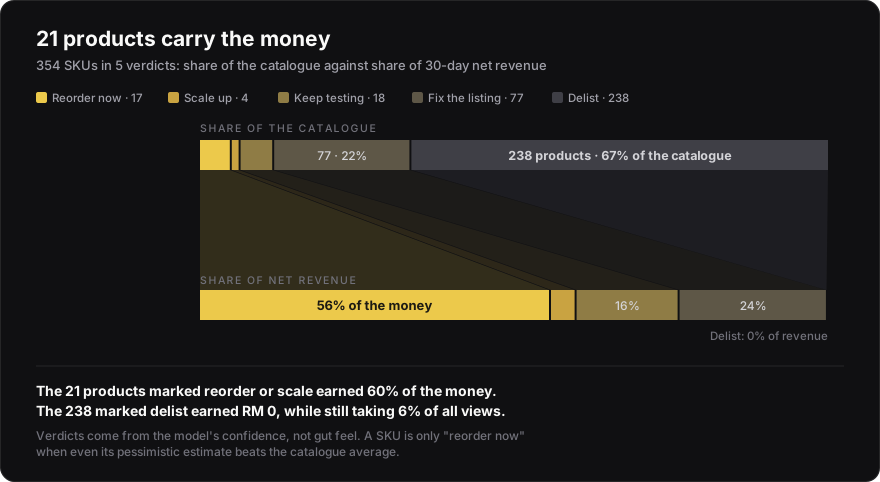
The uncomfortable part is that wide gray block. 238 products, exactly zero sales on either platform in 30 days, still collecting 6% of all views between them. Every dead listing steals a little attention from the ones that deserve it.
So the brand got a restock list of 21 products with actual quantities, worked out from how fast each one really sells and how long the supplier takes to deliver. They got told which categories to push where, denim and polo onto Shopee, tees onto TikTok. They got a delist queue of 238. And one flag on refunds and cancellations running near 9% of sales, which in apparel usually traces back to the size chart, a cheap thing to fix that improves every single listing at once.
Would this find something in your store?
Probably. Every multi-platform seller we have looked at so far had some version of this, a winner sitting in the shadow of the platform they watch most, plus a tail of dead listings nobody got around to clearing.
This read is part of what Labu-Labu does for the brands we enable. Our own AI model watches every product across TikTok Shop and Shopee, continuously, and what your team receives is not a dashboard but a short weekly action list.
If you want it run on your catalogue once to see what it finds, talk to us.